
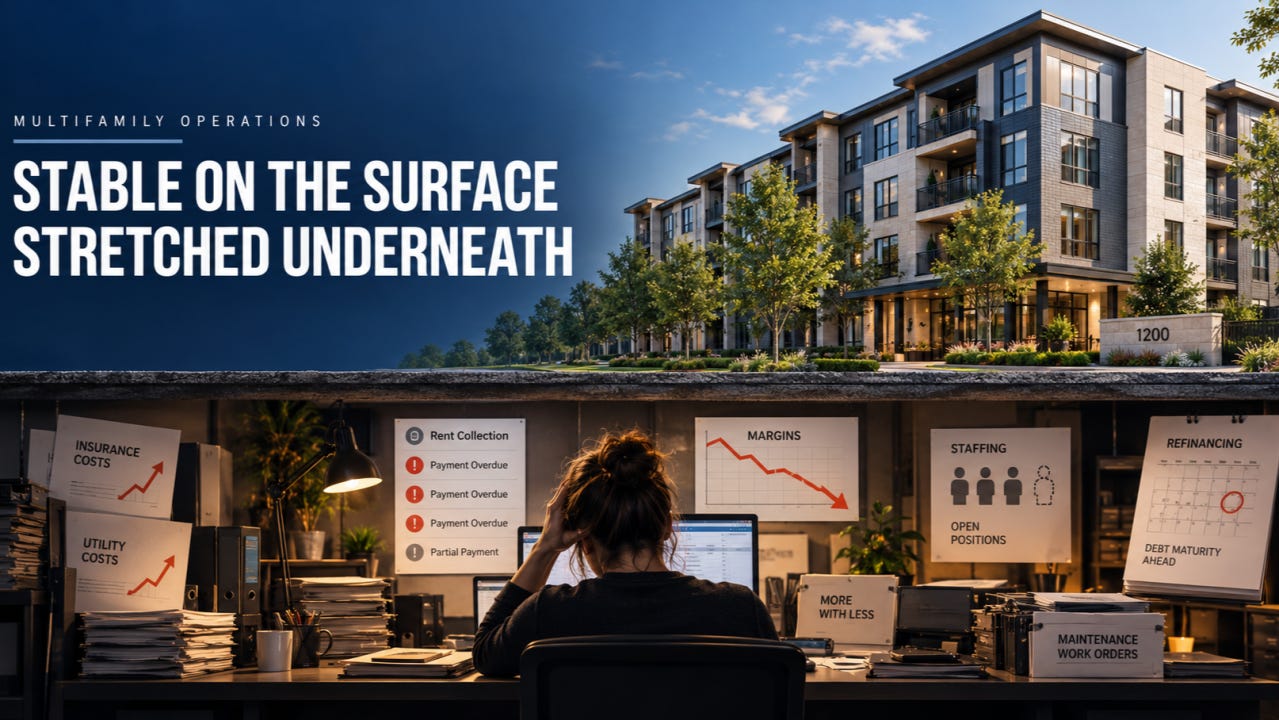
Stable on the Surface, Stretched Underneath: What NAA’s “Holding the Line” Report Gets Right—and What I’m Questioning
In August, the National Apartment Association published “Holding the Line: Rental Housing Operators on Risk, Staffing and Cash Flow Management”, a survey of nearly 400 apartment-industry professionals on staffing, risk, and cash flow. I read the full report before writing this because industry reports usually get reduced to a press release and then repeated until the details disappear.
The report’s core message is that the apartment business looks steady from the outside while the people running buildings are working harder for thinner margins. After 23 years in commercial and multifamily property management, I agree with that. But I also think the report understates some problems, leans on one solution more than the evidence supports, and leaves the most important gap unexamined.
Below, I lay out what it found, what I agree with, and exactly what I’m questioning—and why.
WHAT YOU SHOULD KNOW BEFORE READING THE FINDINGS
Two things frame everything else.
The survey covers nearly 400 professionals, from executives to property managers, and was fielded between mid-February and March 2026 (NAA, “Holding the Line,” p. 2). That is a decent sample, but it is people describing their own situations, not audited numbers. When 54 percent say staffing is “stable,” that is how it feels to them, not a measured turnover rate.
The report was sponsored by Flex, a company that lets renters split rent into smaller payments (p. 18). Five of the report’s 18 pages are about flexible rent payments. That does not make the research wrong, but it means a reader should apply a little more scrutiny to that section, which I do below.
WHAT THE REPORT FOUND
In plain terms, the survey says six things:
Headcount is holding, but people are worn down.
Ninety-one percent call their staffing stable, yet the top two problems are recruiting qualified onsite staff, cited by 42 percent, and burnout, cited by 40 percent. Training staff on new technology ranks third at 23 percent (pp. 4–5).
Chasing rent consumes real time.
Fifty-seven percent of operators say each staff member spends more than five hours a week per property on collections, and 19 percent say more than 10 hours (p. 6). For most operators, that time has either stayed flat, at 45 percent, or increased, at 32 percent, during the past year (p. 7).
Regulation is slowing recovery.
Eviction rules, cited by 54 percent, and notice requirements, cited by 46 percent, are the most frequently identified pressures. They are followed by late-fee caps and rent control (p. 8).
Rising costs—not interest rates—are the biggest concern.
Operating costs such as insurance, utilities, and taxes rank first at 3.3 on a four-point scale. Interest rates and lender pressure rank last at 2.6 (p. 14).
Operators want practical tools, not new housing models.
Flexible payments, deposit alternatives, and centralized leasing draw far more interest than co-living, rent-to-own, or subscription housing (p. 16).
The cash-flow outlook is flat.
Forty-three percent expect no change during the next year, 38 percent expect improvement, and 19 percent expect conditions to worsen (p. 15).
WHERE I AGREE
The report’s best line is that risk “has become less about capital access and more about execution” (p. 17).
For most of the past decade, rent growth covered a lot of operational sloppiness. That cushion is gone. CBRE puts average national rent at $2,257 in the second quarter of 2026, up only 0.5 percent from a year earlier (CBRE, August 2026).
When rents are flat, profit is won or lost in the expense lines and in the gap between what is owed and what is collected. That is a property-level, day-to-day problem.
I also agree that “stable but strained” is the right diagnosis for staffing. The 23 percent who identify technology training as a top challenge deserve more attention than they received.
Technology is sold as a way to lighten the load, but during implementation, it adds to it: new systems, new steps, and new resident questions. The savings come later. The training burden lands now, on the same people already handling collections, renewals, and work orders.
The breakdown by property type on page 7 is also genuinely useful. Affordable, senior, and student housing carry far heavier collection burdens than conventional apartments or commercial properties. That means “rent collection burden” is not one problem with one solution.
WHAT I’M QUESTIONING—AND WHY
Question 1: Is the collections problem really a payment problem?
What the report implies:
Staff spend hours each week on collections, so the solution is to make it easier for residents to pay on time.
Why I question it:
Most of those hours are not spent processing the payment itself. They are spent dealing with what happens after rent is late: pulling reports, sending reminders, posting notices, answering calls, coordinating with attorneys, and documenting everything in case the matter ends up in court.
That is a workflow problem, not simply a payment problem.
The report’s own numbers support this reading. Twenty-four percent of operators say they have automated collection reminders, yet 77 percent say collection time has either stayed flat or increased.
If automation were working as intended, those numbers should move together. My interpretation is that many operators have added a tool on top of an unchanged process. The reminder goes out automatically, but a human still reviews each account, decides on the notice, and logs the contact.
Payment flexibility can reduce the number of accounts entering that pipeline. It does not fix the pipeline itself.
Question 2: Why is the biggest risk receiving the weakest response?
What the report shows:
Rising operating costs are the top-ranked risk, with 89 percent calling them a moderate or high threat (p. 14). However, only 18 percent of operators have adjusted their insurance coverage, reserves, or contingencies in response (p. 15).
Why I question the report’s treatment:
The report notes this mismatch in one paragraph and moves on. I think it should have been the headline.
The industry has correctly identified its largest threat and is mostly responding by working on a different one. Sixty-nine percent strengthened resident-retention efforts, while 55 percent adopted flexible payments or tighter collection rules. Those are revenue-side moves. The damage is happening on the expense side.
Outside data illustrates how serious this is. Trepp found that property insurance costs on securitized apartment properties rose 58 percent over five years, while total operating expenses rose 32 percent against revenue growth of 27 percent (The Real Deal, citing Trepp, August 2026).
When costs outgrow revenue by five percentage points over five years, that is not a cycle. It is a structural squeeze that will not reverse simply because rents begin growing again.
Insurance, in particular, rewards discipline. Loss history, deductible strategy, and the quality of maintenance and inspection records all affect what an operator pays. Operators who treat insurance renewal as a once-a-year purchase instead of a year-round risk-management program are paying for it.
The 18 percent who adjusted coverage and reserves are, in my view, the operators most likely to still have margin in 2028.
Question 3: Should we trust that interest rates are the lowest risk?
What the report shows:
Only 15 percent of respondents rate interest-rate risk as high, and the report suggests that most operators have “secured favorable financing or adapted” (p. 14).
Why I question it:
The lending data suggests otherwise. Multifamily CMBS delinquency reached 7.23 percent in June 2026, up from 5.91 percent a year earlier. Bank-held apartment loan delinquency reached 1.47 percent in the first quarter, tying the highest level recorded since 2013 (Multifamily Dive, citing Trepp and CRED iQ, July 2026).
I do not think respondents are wrong about their own situations. I think the survey was answered by operators—and operators do not carry the debt.
Loans taken out in 2021 and 2022 at low floating rates are an ownership problem. The property manager may not feel the consequences until the owner cuts the capital budget, postpones the roof replacement, or sells to a buyer that brings in a different management company.
When financial stress reaches the property, it appears as deferred maintenance and reduced staffing. That feeds directly back into the burnout and turnover the report already documents.
The low ranking is not reassurance. It is a lag.
Question 4: Are the flexible-rent findings reliable, given who paid for the report?
What the report shows:
Fifty-six percent of respondents offer flexible payments across their portfolios, and another 19 percent offer them at some properties (p. 9). Among operators who offer flexible payments:
69 percent report better on-time payments and lower delinquency.
51 percent report fewer evictions.
49 percent report better resident retention (p. 10).
My assessment:
I went into this section skeptical because of the sponsor, but I came away believing the findings are directionally credible for three reasons.
First, this is not a new idea being pushed by one vendor. Operators have allowed residents who are paid biweekly to split rent for as long as I have been in the business. The difference is that the process is now systematized.
Second, the reported benefits are modest and specific, which is what honest data about a payment-timing tool should look like. Only 12 percent report revenue growth, and 8 percent report no impact at all.
Splitting payments does not create money. It reduces friction and losses.
Third—and this is the finding I would have led with—55 percent adopted flexible payments, while 55 percent adopted stricter collection policies. The report says the two strategies are being pursued together (p. 15).
That is the correct approach.
Flexibility without enforcement becomes informal forgiveness, which is how bad debt accumulates. Enforcement without flexibility produces evictions that can cost more than the rent recovered.
Where I remain cautious:
Forty-four percent said a 1 to 5 percent improvement in on-time payments would be meaningful (p. 12). The report presents this as proof that small gains matter. It is also proof of how thin margins have become.
When a two-point improvement is a significant event, there is very little cushion for anything else going wrong.
Question 5: Who is being left out of the averages?
What the report shows:
Fifty-eight percent of operators with fewer than 150 units describe their staffing as “very stable,” compared with only 18 to 19 percent of large operators (p. 4).
However, 48 percent of the smallest operators have not adopted flexible payments, compared with approximately 20 percent of the largest operators (p. 13).
Why it matters:
Small operators are often more stable because they have fewer moving parts and the owner is frequently onsite. They adopt less technology because the vendor economics do not work below a certain portfolio size.
The real question the report does not ask is whether the tools helping large operators will ever reach smaller operators, who house a significant share of renters in secondary and tertiary markets.
If not, the gap between institutional and independent ownership will widen, and housing quality may suffer in ways no member survey will capture.
Question 6: How can 8 percent of operators not know their own late-payment rate?
What the report shows:
Eight percent of respondents lack visibility into late-payment rates at the portfolio level (p. 12).
Why I’m flagging it:
These are industry professionals answering a survey about cash flow, and one in 12 cannot say what share of rent arrives late.
The percentage is almost certainly higher among operators who do not respond to NAA surveys.
An operator cannot evaluate a payment program, collection policy, or staffing model against a metric the organization does not track. This is a basic reporting gap, and it should be addressed before purchasing any new tool.
WHAT THE REPORT CANNOT SEE
Three important issues sit outside the report’s frame.
First, it measures operator perceptions, not resident outcomes.
Whether flexible payments actually improve household finances—or merely shift the timing of the same shortfall—is not something this data can answer.
Second, it does not measure what slips when teams are stretched.
In my experience, when a site team is absorbing collections, technology training, and turnover pressure at the same time, the work that quietly deteriorates is the work without an immediate deadline:
Routine inspections
Preventive-maintenance follow-through
Documentation of resident communications
Consistent application of policies across every unit
None of that appears in a cash-flow survey. All of it determines whether a property holds up when something goes wrong.
Third, the report does not break results down by market.
The report acknowledges that 37 percent of respondents see minimal regulatory risk, while 28 percent see it as high (p. 14). National averages describe no actual market. Operators in different states are answering the same questions while operating under entirely different rules.
WHAT I WOULD DO WITH THIS INFORMATION
If I were advising an operator reading this report, I would recommend the following:
Measure collection hours before buying a solution.
Track the time spent per property, per week, and by task for one quarter. This will reveal whether the real problem is payment timing, follow-up workflow, or documentation. Each problem requires a different solution.
Treat insurance and reserves as a program—not an annual renewal.
This is the industry’s number-one risk and the area receiving the weakest response. Review loss runs, document risk controls, reconsider deductibles, and establish reserves that reflect actual expense volatility.
It is unglamorous work with one of the highest returns currently available.
Pair flexibility with a written, consistent collection policy.
Give residents a structured way to pay on time. Clearly define when accounts escalate, apply the policy consistently across every property, and document each step.
Centralize the follow-up—not just the software.
Move routine delinquency work to a small central team with clear authority. Allow onsite staff to spend more of their time on renewals, resident service, and the physical building.
Budget training as operational capacity.
Untrained staff using new systems create losses just as employee turnover does. Training time must be treated as necessary capacity, not an extra task employees are expected to absorb.
Build the dashboard first.
Track delinquency by property, aging category, and trend. Have the people responsible for setting policy review the information monthly. Everything else depends on it.
Know the debt on the buildings you manage.
When a loan matures or an interest-rate cap expires, the operating budget is about to change. The onsite team will often feel the impact first.
THE BOTTOM LINE
“Holding the line” is a defensive posture, and it accurately describes an industry that has stopped counting on the market to cover its operational shortfalls.
There is good news in the broader data. CBRE reported net absorption of 167,500 units during the second quarter of 2026—nearly double the first quarter—with vacancy declining to 4.3 percent as new construction fell 14 percent year over year (CBRE, August 2026).
The supply wave is cresting. However, Yardi Matrix counted almost 1.3 million units still in lease-up in June and expects rent growth to remain modest through the end of the year (Yardi Matrix, June 2026).
Relief will be slow. Expenses will not wait for it.
My assessment is that the report is correct that the industry is taking sensible, incremental steps. The operators who come out ahead will be the ones who know their delinquency rate to the tenth of a percent, treat insurance as risk management rather than purchasing, follow a written collection process, and protect their teams’ time for the work that never appears on a dashboard until it is too late.
The open question for every operator is whether incremental improvement is moving fast enough to keep pace with the cost curve they are actually facing.
Originally published on LinkedIn on September 17, 2026. Republished here from the original article.
Emily C. Shortall, CPM®, ARM®, also known professionally as Emily Goodman Shortall and Emily Shortall, works in commercial and multifamily property management and provides operational advisory and separately engaged expert-witness services. Historical bylines are retained for attribution; they are not a statement of current credential status.